
Summary
The protocols we provide for Ready Reporter Virus (RRV) kits are based on flow cytometric readout; however, RRV neutralization assays are also compatible with high-content imagers, such as the Agilent BioTek Cytation. This guide provides our recommendations on instrument specifications, assay setup, imaging acquisition, and analysis for the Cytation.
This guide provides information on:- LED/filter cube sets that have been tested with the RRV kit.
- Laboratory consumables and assay setup are adapted to remove agitation of cells.
- Recommendations on image analysis for infected cell counting.
High-content imagers offer a rapid and powerful means of reading out same-day RRV neutralization assays.
This guide is intended for use with RRV kits that use HEK-293T-derived target cells, listed below.
Introduction
This guide is for users of the Ready Reporter Virus (RRV) kit who have experience with the Agilent BioTek Cytation 5 automated microscopy platform. It may be used alongside our standard RRV infectivity and neutralization protocols for readout by fluorescence microscopy. With appropriate adaptation, RRV kit results are highly comparable between flow cytometric and imaging readouts.
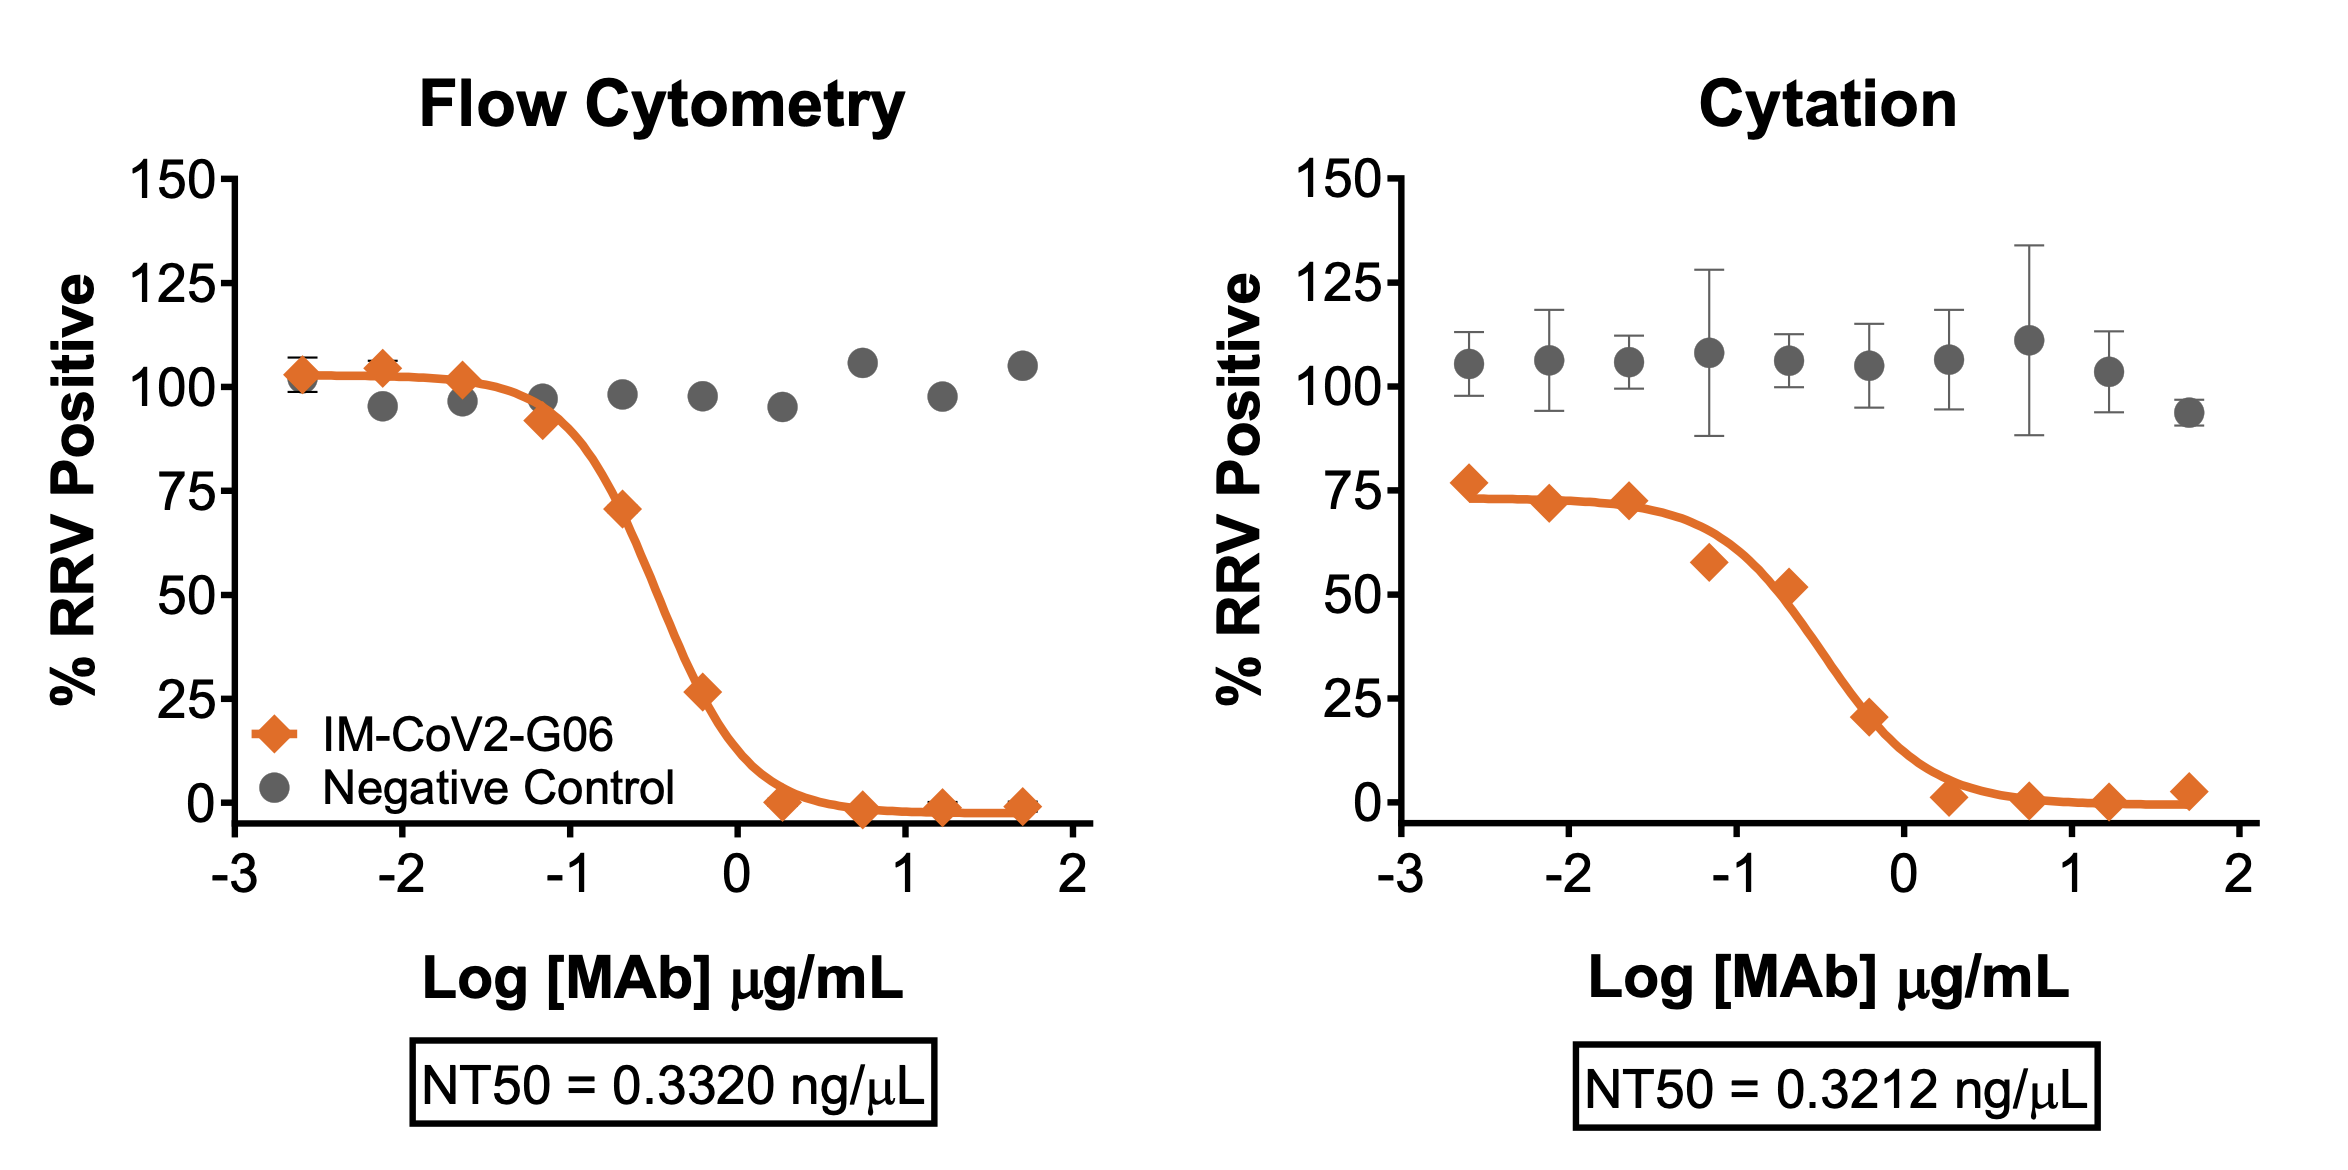
Comparison of Flow Cytometry- and Imaging-Based Readout. SARS-CoV-2 D614G RRVs were incubated with neutralizing antibody (IM-CoV-2G06) or negative control antibody for 1 hour prior to infecting HEK-ACE2 Target Cells for 3 hours. Infected Target Cells were measured by flow cytometry (left) or imaging on the Cytation 5 (right). NT50 values were determined from lines of best fit to neutralization data.
RRV Kit Overview
Ready Reporter Virus (RRV) kits use a pseudovirus system that models authentic viral entry in the absence of viral genetic material. Each kit includes non-replicative, pseudotyped reporter virus particles that display relevant viral envelope proteins, along with permissive target cells pre-loaded with reporter dye. When the viral particles fuse with the cell membrane, they deliver an enzyme reporter. The enzyme triggers a change in the fluorescent reporter substrate inside the infected cell. This fluorescent signal allows you to quantify viral infectivity or neutralization by microscopy.
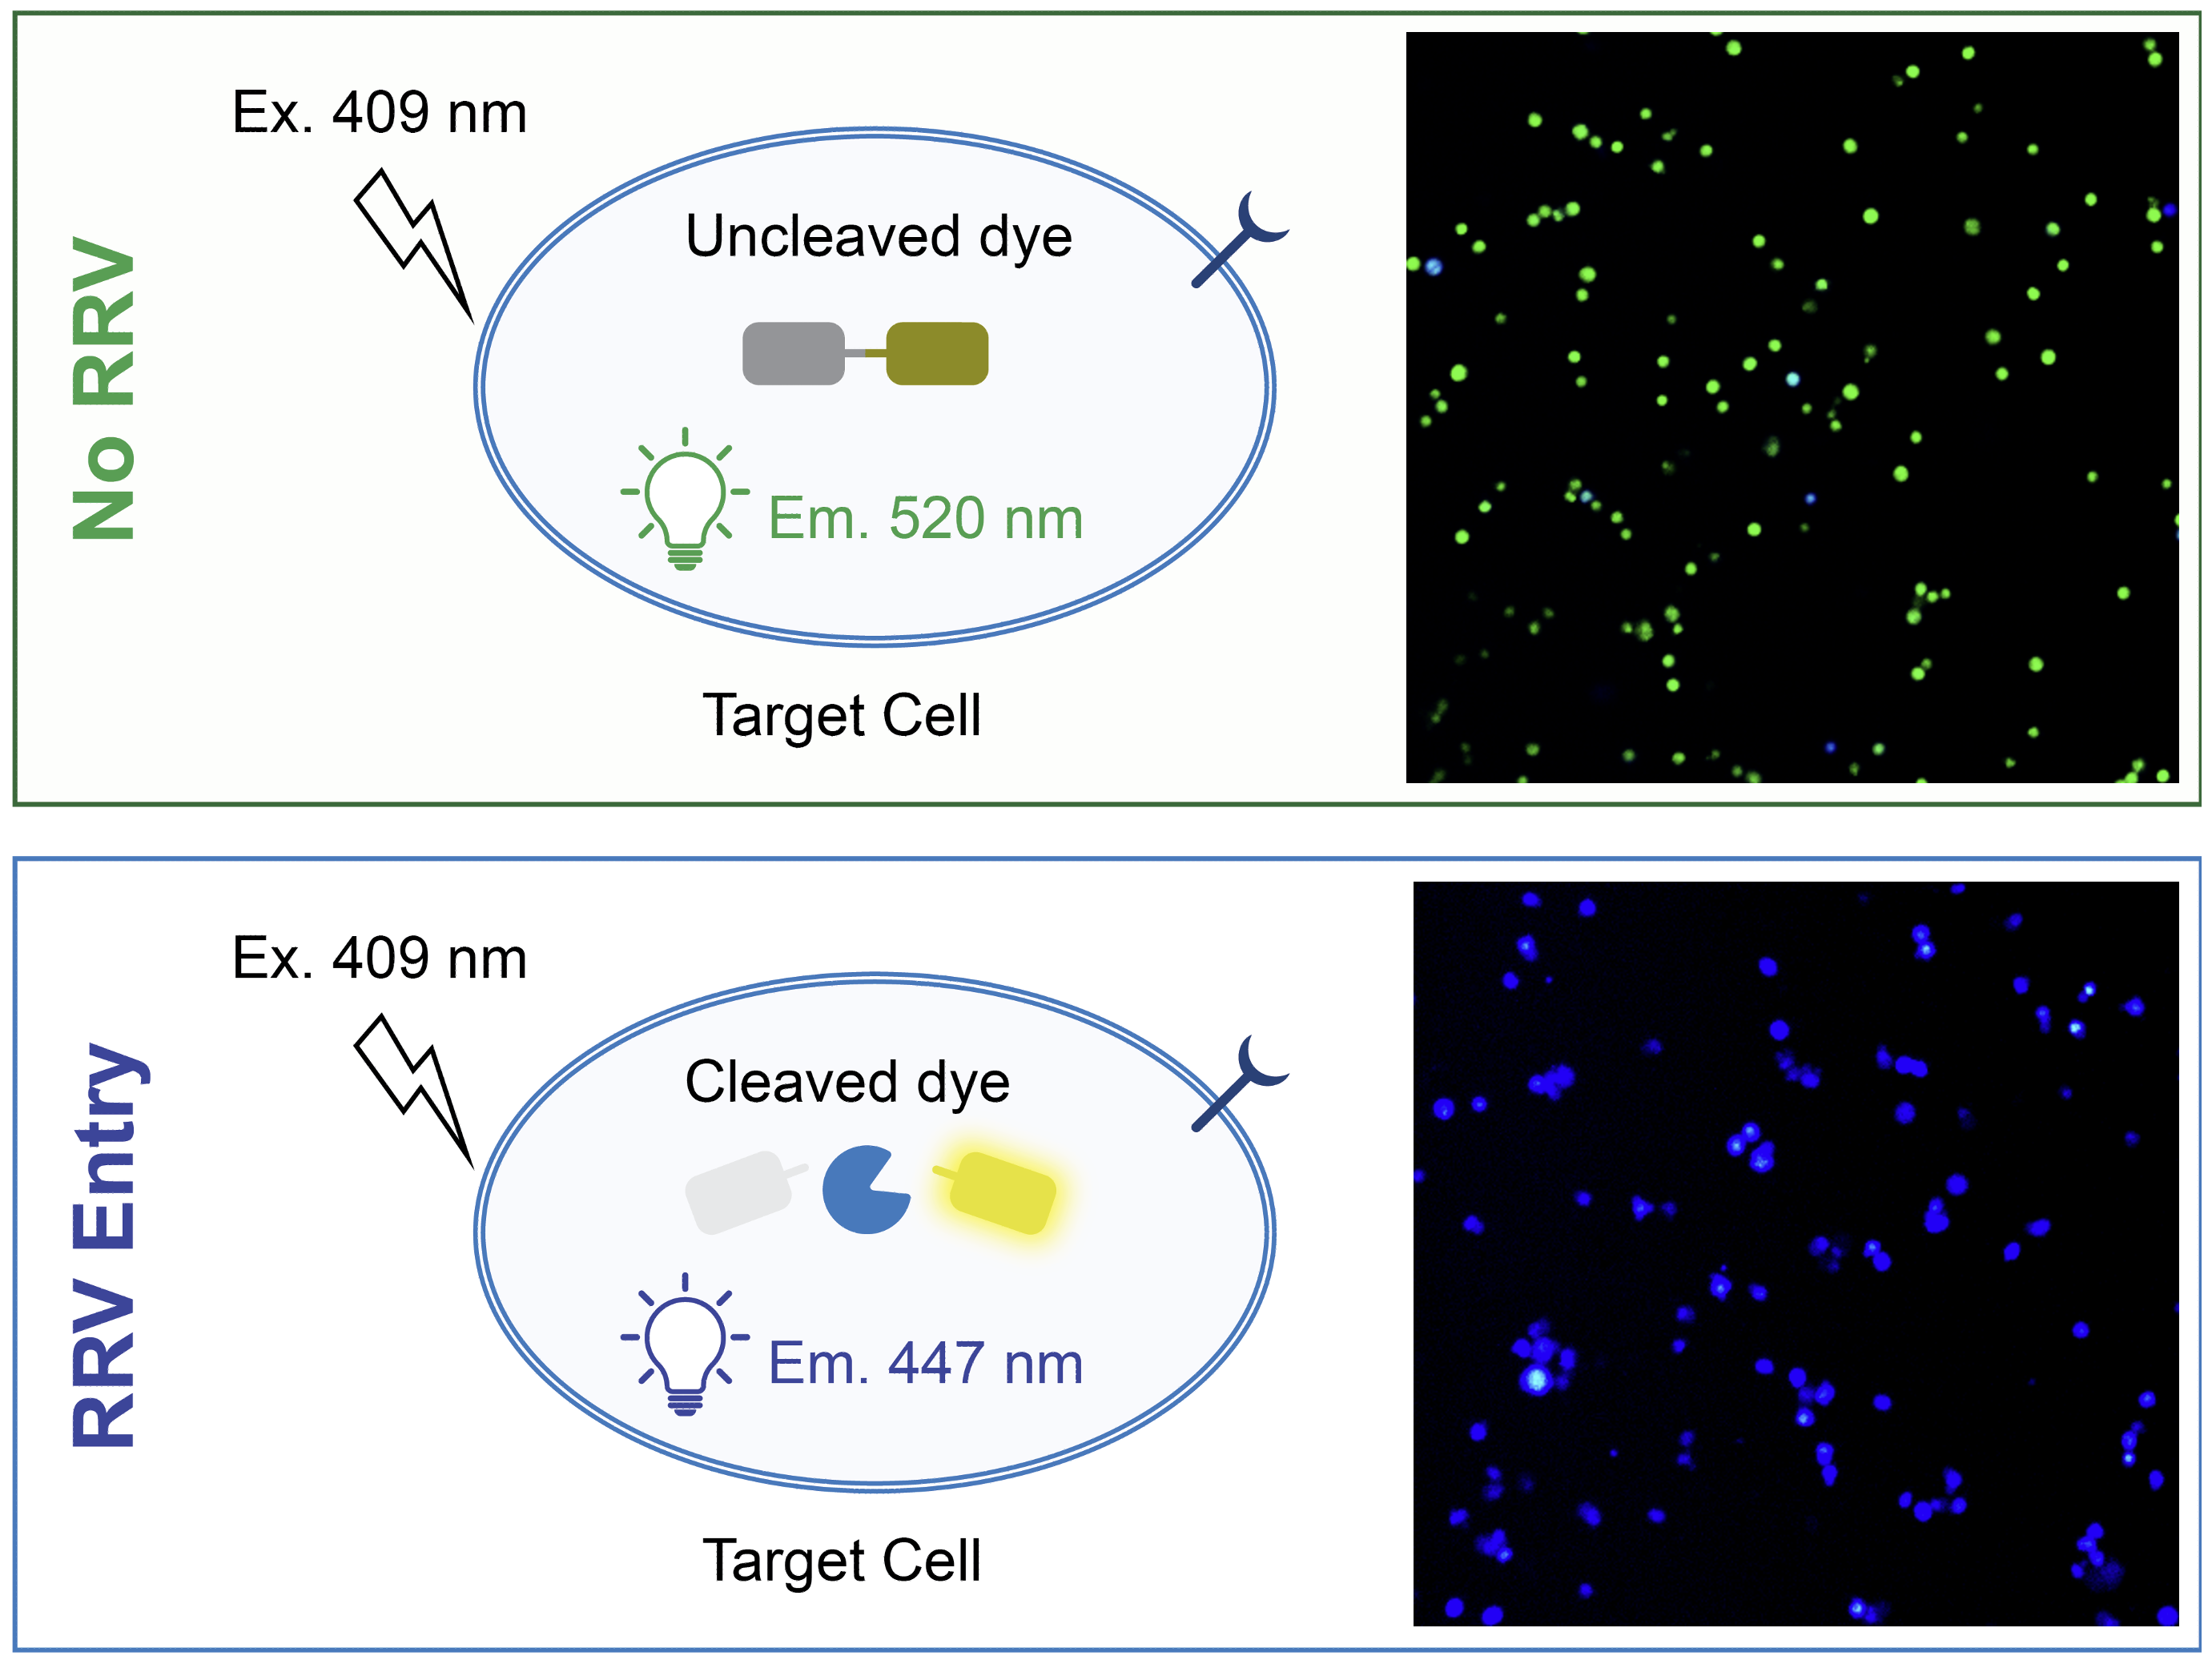
Excitation and emission spectra in an uninfected (green box, top) or infected (blue box, bottom) Target Cell. Representative images of overlaid 520 nm and 447 nm fluorescence.
Assay Plate Setup
Infectivity or neutralization assay setup for imaging readout largely follows the protocols for readout by flow cytometry, with adaptations listed in the table below. Recommended serial dilutions for neutralizing samples, RRV particle input, and Target Cell seeding density do not need to be adapted unless improvements are empirically determined.
| Protocol Step | Protocol Component | Adaptation for Imaging Readout |
|---|---|---|
| Plastics | 96-well U-bottom assay plate | 96-well Nunc optical-bottom plate |
| Neutralization Setup | Plate shaking or mixing at each hour during |
Do not shake or mix Prior to imaging, spin down plates at 1500 rpm for 2 minutes. |
Data Collection by Imaging
As during assay setup, plate shaking should not be enabled for readout by microscopy. Viable Target Cells fluoresce at 520 nm. Infected Target Cells fluoresce at both 520 nm and 447 nm. Therefore, acquiring and analyzing infection is performed with the Em. 409 nm/Ex. 447 nm channel. This guide describes acquisition and analysis using readily available catalog parts developed for mTagBFP imaging; custom LED and filter cube sets may further minimize background signal.
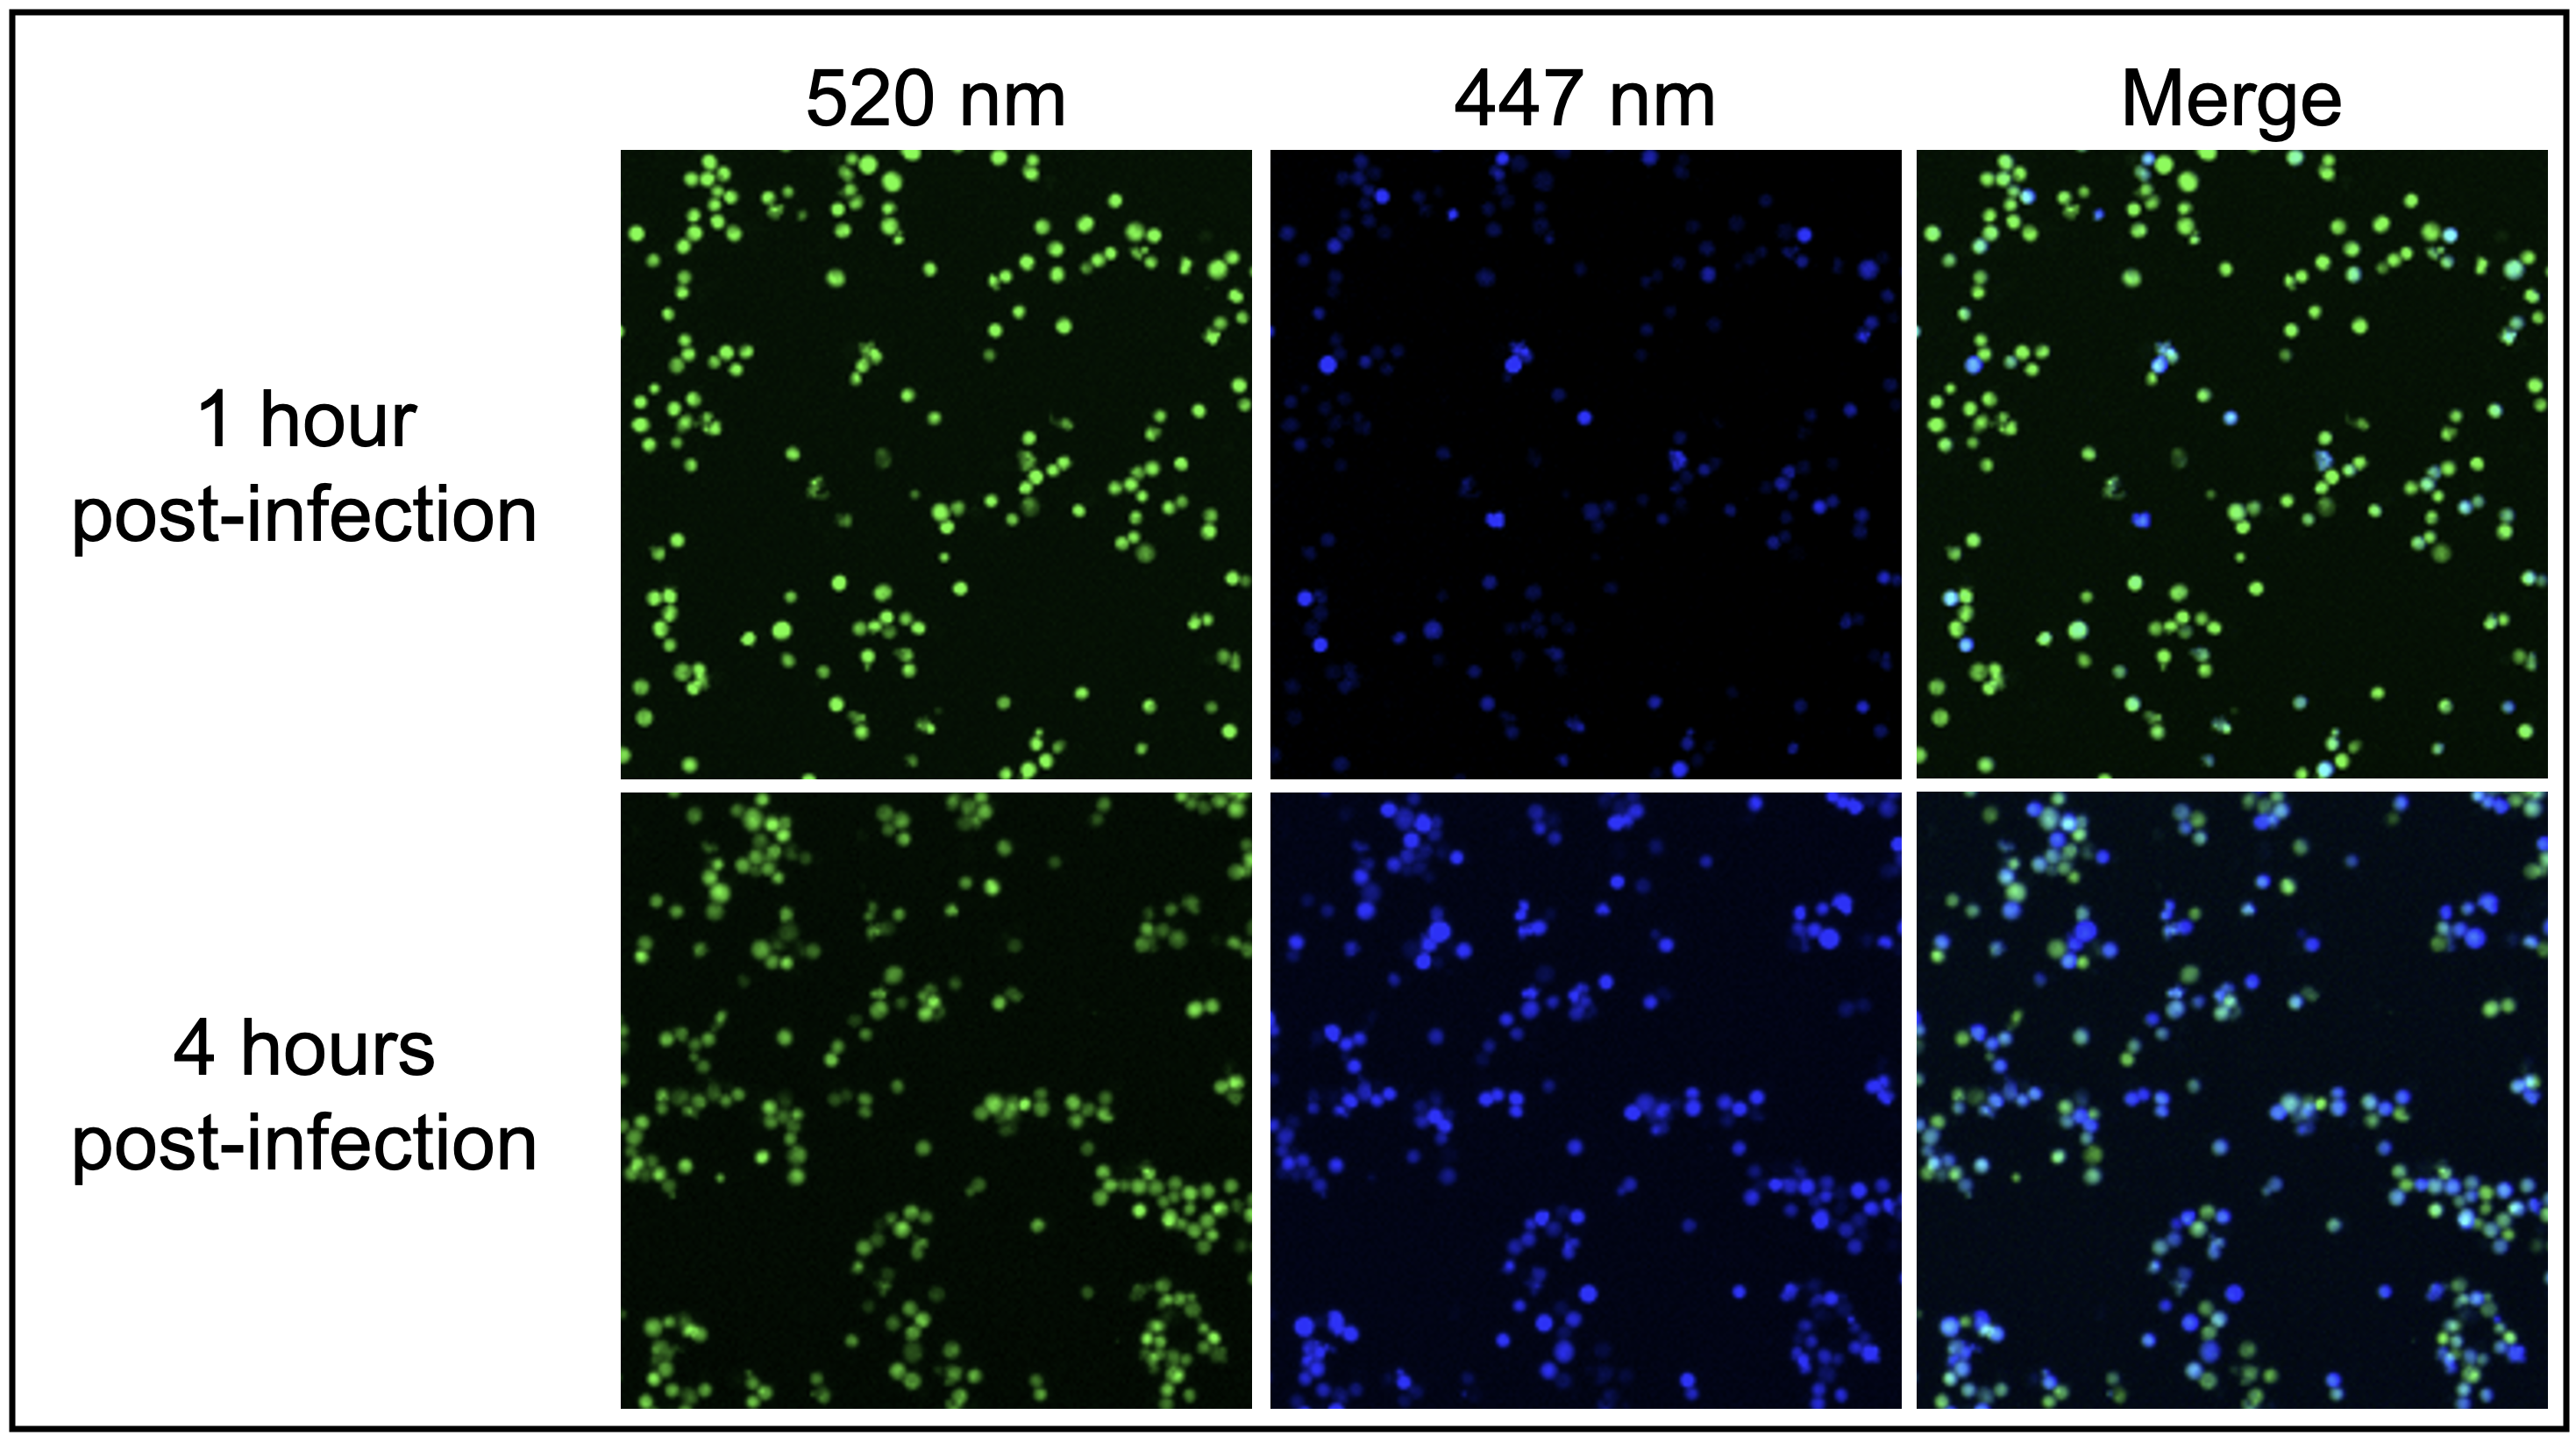
Representative images of fluorescence in infectivity assay. SARS-CoV-2 D614G RRV infection of HEK-ACE2 Target Cells (catalog #RRK-702). Images of uncleaved dye (Em. 520 nm), cleaved dye (Em. 447 nm), and merged channels. Images were taken at 1 hour post-infection (top row) and at 4 hours post-infection (bottom row).
| Channel Name | Excitation | Emission | Reporter |
|---|---|---|---|
| mTagBFP | 409 nm (1225009 | Agilent) |
447 nm (1225115 | Agilent) |
Infected Target Cell |
| GFP | 409 nm (1225001 | Agilent) |
520 nm (1225101 | Agilent) |
Target Cell |
Acquisition and Analysis with the Cytation 5 and Gen5 Software
| Gen5 Menu | Gen5 Setting | Suggested Value |
|---|---|---|
| Procedure | Plate Type | Nunc 96 well optical bottom plate |
| Procedure | Actions | Image |
| Imaging Step-Inverted Imager | Magnification | 4X |
| Imaging Step-Inverted Imager | Channels | (1) GFP, (2) TagBFP |
| Focus options... | For Channel 1: Auto For Channel 2: Focal height from first channel (+ offset): 0 |
|
| Experiment | Load Plate | Use Lid |
| Gen5 Menu | Gen5 Setting | Suggested Value |
|---|---|---|
| Data Reduction | Image Analysis | Cell Counting |
| Cell Counting | Channel | TagBFP |
| Cell Counting | Threshold |
Value: determine for your instrument using Line Profile Background: Dark ✓Split touching objects |
| Cell Counting | Object selection |
Min. object size: 12 µm Max. object size: 20 µm |
| Cell Counting | Advanced detection options... |
✓Background flattening Rolling ball diameter: 20 µm Image smoothing strength: 2 |
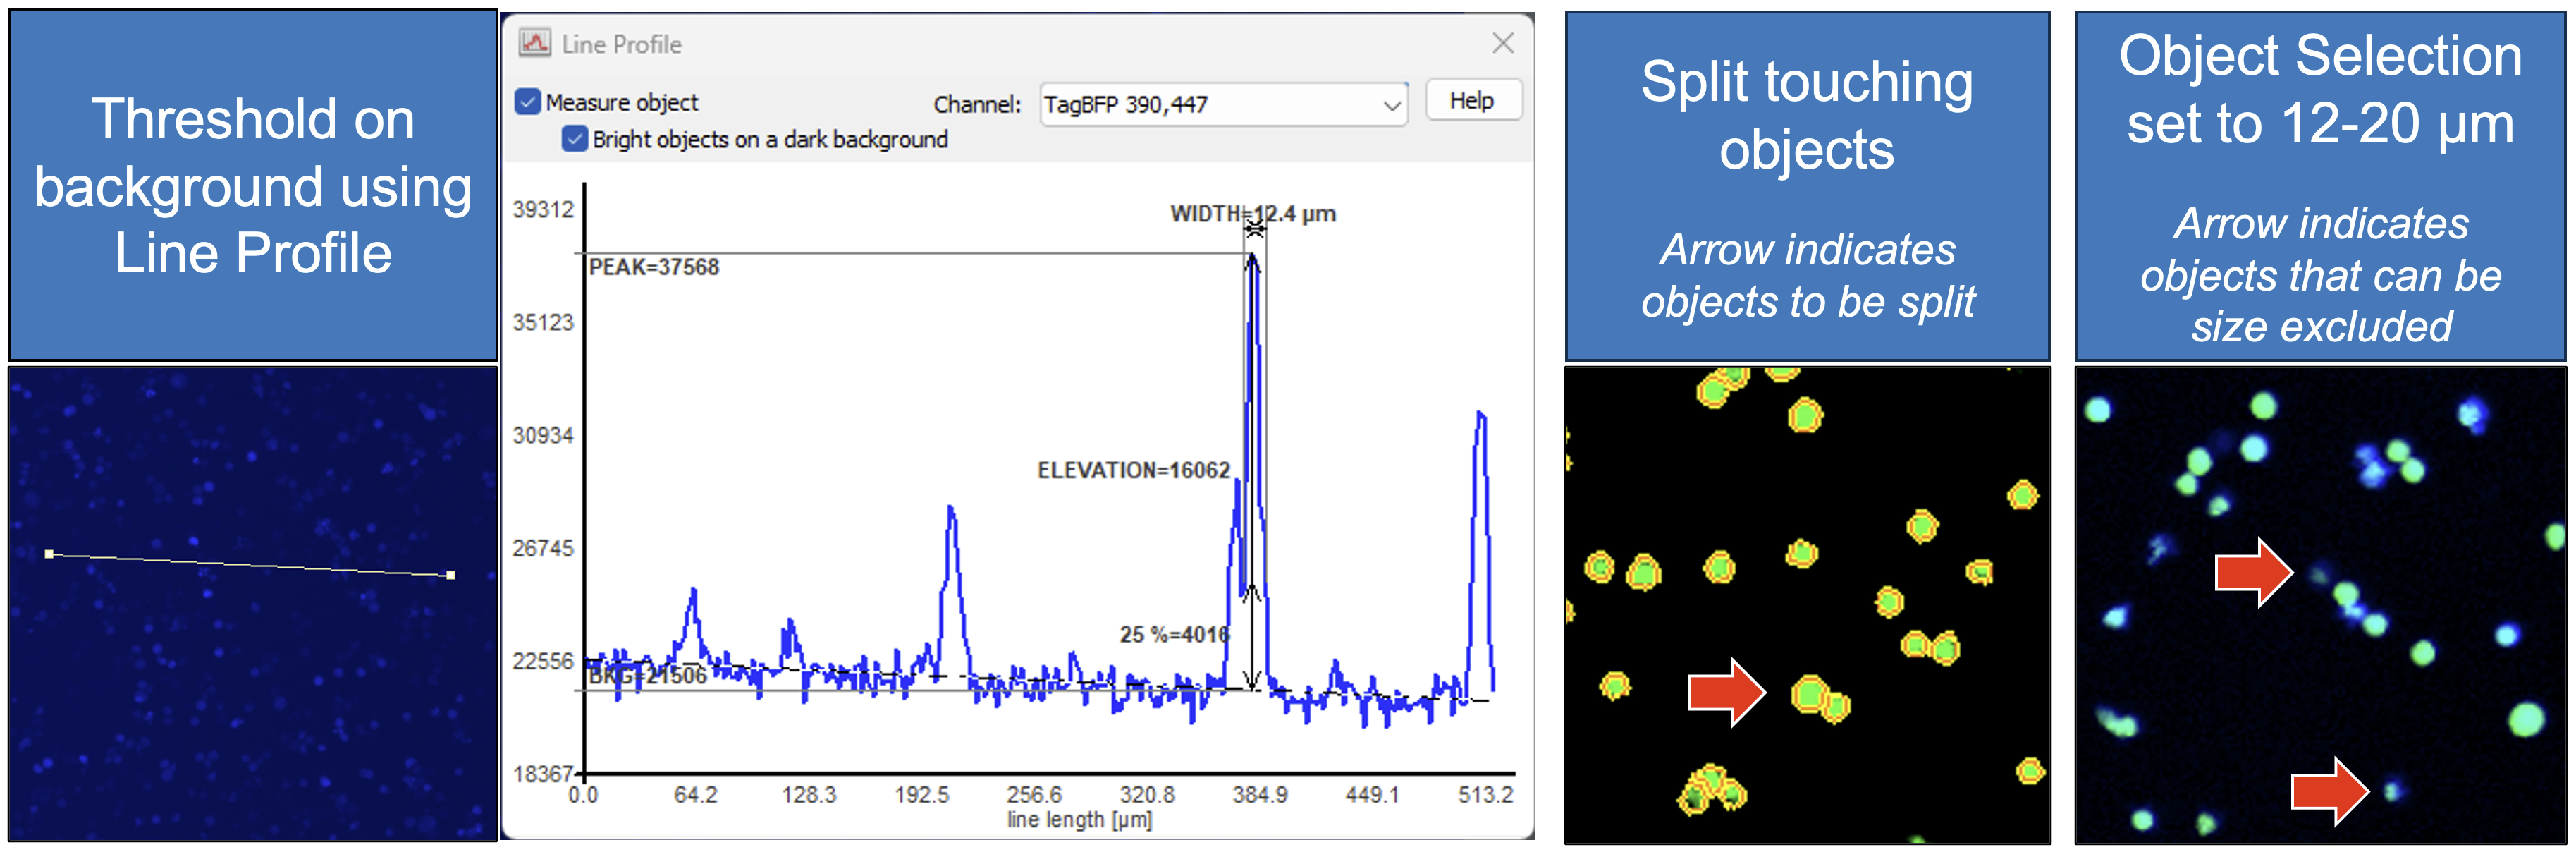
Representative Images showing examples of Gen5 software features for setting up Cell Count Analysis. Line Profile may be used to determine appropriate background and thresholding settings (left). Electing to split touching objects enables more accurate cell counting (middle). Selecting objects or Regions of Interest based on a size between 12-20 µm eliminates most debris in the field (right).
Frequently Asked Questions